

Rochdale SpeedometersSM
Forward-Looking Six to Nine Months
 Positive
 Neutral
 Negative
 Current
 Change
from Last month


Our Proprietary Global Economic & Market Summary Indicators
Select one or more speedometers from below to share or print
-
Business Outlook Spending/Surveys


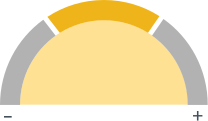
Neutral
Business Outlook Spending/Surveys
What we see
Surveys of the business community on current and expected trends. This is a gauge on businesses' spending plans that provides an insight into wages, inflation, and capital equipment spending.
Change over last three months
-
Neutral
Aug. 2022
-
Neutral
Jul. 2022
-
Positive
Jun. 2022
-
-
Yield Curve
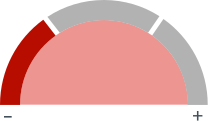
Negative
Yield Curve
What we see
The shape of the yield curve gives an idea of future interest rate changes and economic activity. There are three common yield curve shapes: normal, inverted, and flat. A normal yield curve is one in which longer maturity bonds have a higher yield compared to shorter-term bonds, due to the risks associated with time, and can signal improving economic growth. An inverted yield curve is one in which the shorter-term yields are higher than the longer-term yields, which can be a sign of upcoming recession. In a flat or humped yield curve, the shorter- and longer-term yields are very close to each other, which is also a predictor of an economic transition.
Change over last three months
-
Negative
Aug. 2022
-
Neutral
Jul. 2022
-
Neutral
Jun. 2022
-
-
Disposable Personal Income
Neutral
Disposable Personal Income
What we see
The amount of money households have available for spending and saving after income taxes. A change in a household's real income is by far the most important factor in determining how much that household will spend. Other factors, such as home values or financial savings, matter as well but to a significantly lesser extent.
Change over last three months
-
Neutral
Aug. 2022
-
Neutral
Jul. 2022
-
Positive
Jun. 2022
-
-
Labor Market
Positive
Labor Market
What we see
Research has shown that employment and income expectations, along with credit availability, are the most important determinants of consumer spending. Personal consumption amounts to roughly 70% of GDP, making a strong labor market essential to a healthy economy.
Change over last three months
-
Positive
Aug. 2022
-
Positive
Jul. 2022
-
Positive
Jun. 2022
-
-
Fixed Income Outlook
Neutral
Fixed Income Outlook
What we see
Higher-than-expected inflation readings continue and we project the Federal Reserve will end 2022 between 3.25%-3.50% on Federal Funds. Supply issues remain and have been exacerbated by the war in Ukraine, which has driven commodity and food prices higher. While the Fed can fight traditional sources of inflation - primarily demand-related - it is critical that the now entrenched supply issues brought on by COVID-19 start to improve. Despite the unprecedented situation, long-term interest rates are still at levels consistent with the average of the last 10-years, although the sharp adjustment off of the pandemic floor has created high volatility across Fixed Income. Higher for longer inflation is likely to pressure rates through the rest of this year and into 2023 with the potential to reach 4% on the U.S. 10-Year Treasury. With higher rates and credit concerns stemming from a slowdown in growth, certain areas of the market are starting to look fairly valued. Specifically, we believe certain sectors of below-investment grade markets that have low-interest rate exposure are reflecting more attractive entry points, although we remain cautious at this stage in the economic cycle. We also believe that municipal bonds offer attractive value relative to corporate bond peers and, for investors looking to shield income from taxes, we believe there are many income opportunities that make sense at today’s yield levels. We expect rates to stabilize in 2022 between 3.25-3.75% and we are still wary of adding interest rate exposure, despite the potential for increased forward returns based on the movement in interest rates. The push and pull between inflation and growth concerns will continue to keep volatility high in the bond market, so we recommend utilizing pockets of the short-duration market where yields have risen in order to tactically shift into risk when it becomes attractive.
Change over last three months
-
Neutral
Aug. 2022
-
Neutral
Jul. 2022
-
Neutral
Jun. 2022
-
-
Consumer Spending
Positive
Consumer Spending
What we see
Aggregate level of consumer spending. Since consumers are the largest driver of the U.S. economy, their spending patterns have a large impact on overall economic activity.
Change over last three months
-
Positive
Aug. 2022
-
Positive
Jul. 2022
-
Positive
Jun. 2022
-
-
Interest Rates
Negative
Interest Rates
What we see
Interest rates control the flow of money in the economy. High interest rates curb inflation, but also slow down the economy. Low interest rates stimulate the economy, but could lead to inflation. Interest rates affect the economy slowly. When the Federal Reserve changes the Fed Funds rate, it can take 12-18 months for the effect of the change to percolate throughout the entire economy.
Change over last three months
-
Negative
Aug. 2022
-
Negative
Jul. 2022
-
Neutral
Jun. 2022
-
-
Fiscal Policy
Neutral
Fiscal Policy
What we see
Changes in tax rates, regulation, and government spending affect the decision-making process of consumers and businesses. By changing tax laws, the government can effectively modify the amount of disposable income available to taxpayers or raise the costs for businesses. However, this process takes time, as the money needs to wind its way through the economy, creating a significant lag between the implementation of fiscal policy and its effect on the economy.
Change over last three months
-
Neutral
Aug. 2022
-
Neutral
Jul. 2022
-
Neutral
Jun. 2022
-
-
Consumer Sentiment
Neutral
Consumer Sentiment
What we see
How consumers feel about their overall financial health as well as that of the economy on the short and long term. This is an important indicator, as the consumer is the largest driver of the U.S. economy.
Change over last three months
-
Neutral
Aug. 2022
-
Neutral
Jul. 2022
-
Positive
Jun. 2022
-
-
Leading Indexes
Neutral
Leading Indexes
What we see
We look at a number of indices that have a strong track record in anticipating turns in business cycles. These include measures of production, employment, income, and sales, which have a strong correlation to subsequent economic activity. These indices provide a comprehensive summary gauge of future U.S. economic conditions, with an average lead of 12 months at business cycle peaks and 6 months at business cycle troughs.
Change over last three months
-
Neutral
Aug. 2022
-
Neutral
Jul. 2022
-
Positive
Jun. 2022
-
-
Corporate Profit Growth
Neutral
Corporate Profit Growth
What we see
Corporate earnings have a significant influence on the stock market as they ultimately drive stock prices. The value of securities is the present value of all future cash flows. Companies either reinvest earnings or pay them out to shareholders as dividends, which directly impact the stock price. As future expectations increase, future projections of company earnings will also increase.
Change over last three months
-
Neutral
Aug. 2022
-
Neutral
Jul. 2022
-
Positive
Jun. 2022
-
-
Equity Outlook
Neutral
Equity Outlook
What we see
Given the strong relative advantages the US economy enjoys over other regions of the world, we continue to favor US equities. Today’s environment of heightened uncertainty favors companies with records of large-cap secular growth, stability and defensiveness. These characteristics define a much higher proportion of the U.S. market relative to the rest of the world, Still, rising risk to the outlook indicates near term caution remains warranted and we have lowered our overall equity exposure to a modest underweight. Despite the recent rebound in equity markets, we continue to see additional downside potential for stock prices in the coming months. While valuations have adjusted quite a bit, consensus earnings estimates remain too high and have not yet discounted an increasing risk of an economic downturn. Big rallies in bear markets are common, and major bottoms tend to see a retest of previous lows. We think investors will need better clarity on the path of inflation and Fed tightening, as well as the outlook for economic and earnings growth, before a sustainable rally takes hold. In the meantime, we remain focused on holding high-quality, reasonably valued US companies with durable franchises and strong management teams to help weather a recession should one occur.
Change over last three months
-
Neutral
Aug. 2022
-
Neutral
Jul. 2022
-
Positive
Jun. 2022
-
-
Political Environment
Neutral
Political Environment
What we see
The overall political climate in the U.S. with a focus on whether it will be supportive or restrictive to economic growth. For instance, while the state of discourse in politics can be tense and deadlocked, it may not be restrictive to growth. Conversely, there could be bipartisan action that is restrictive to growth. It is important to note that this category refers not to the state of discourse, but to the market impact.
Change over last three months
-
Neutral
Aug. 2022
-
Neutral
Jul. 2022
-
Neutral
Jun. 2022
-
-
Inflation
Negative
Inflation
What we see
While a slow, persistent rise in prices is consistent with a healthy, growing economy, a rapid increase in inflation, especially if unanticipated, can be harmful. Inflation means higher consumer prices, which often slows sales and reduces profits. Higher prices often lead to higher interest rates. Over time, inflation can also wear away at the value of stocks, which is why it is crucial to monitor.
Change over last three months
-
Negative
Aug. 2022
-
Negative
Jul. 2022
-
Neutral
Jun. 2022
-
-
Credit Demand / Availability
Neutral
Credit Demand / Availability
What we see
Availability of credit from banks and the overall financial sector to provide capital to the economy. Restrictive credit conditions are a headwind to economic activity, while accommodating conditions may boost it.
Change over last three months
-
Neutral
Aug. 2022
-
Neutral
Jul. 2022
-
Positive
Jun. 2022
-
-
Energy Costs
Neutral
Energy Costs
What we see
Significant changes in energy/oil prices can have important but differing impacts on the overall economy. Higher energy prices act as a tax on consumers and businesses, absorbing money that would normally be used to buy other goods. However, they can also boost production and investment in the mining and energy sectors of the economy. Lower energy prices can increase consumer spending and lower manufacturing costs.
Change over last three months
-
Neutral
Aug. 2022
-
Neutral
Jul. 2022
-
Neutral
Jun. 2022
-
-
Equity Market Valuation
Neutral
Equity Market Valuation
What we see
Questions of value are always subjective and relative. We believe that equity market valuation should be measured against both the value of stocks at their historical levels and the other investment options available. A stock is worth its future earnings, but that involves a degree of uncertainty, which affects its price depending on the degree. In addition, investors have many other asset classes to choose from, including corporate bonds, Treasury bonds, alternative investments, and the like. We look at all of these factors before we determine what we believe to be a fair equity market valuation.
Change over last three months
-
Neutral
Aug. 2022
-
Neutral
Jul. 2022
-
Neutral
Jun. 2022
-
-
Housing / Mortgages
Negative
Housing / Mortgages
What we see
Housing is an important indicator of the overall economy and a key driver of investment and job growth. We look at such things as starts, permits, foreclosures, delinquencies, and bank lending to assess the sector's health.
Change over last three months
-
Negative
Aug. 2022
-
Neutral
Jul. 2022
-
Neutral
Jun. 2022
-
-
Geopolitical Risk
Negative
Geopolitical Risk
What we see
Geopolitical risk examines how geography and economics influence politics and international relations. Geopolitical risk includes the risk associated with international policy, trade, and global financial market stability, as well as wars, terrorist acts, tensions between states, and other events that can impact the normal and peaceful course of international relations.
Change over last three months
-
Negative
Aug. 2022
-
Negative
Jul. 2022
-
Negative
Jun. 2022
-
-
International Economic Outlook
Neutral
International Economic Outlook
What we see
The world has become increasingly interconnected through trade and the flow of capital, and emerging markets in particular have risen in importance as drivers of global growth. Moreover, we believe a global perspective is integral to any investment strategy.
Change over last three months
-
Neutral
Aug. 2022
-
Neutral
Jul. 2022
-
Neutral
Jun. 2022
-
Important Information
The information presented does not involve the rendering of personalized investment, financial, legal, or tax advice. This presentation is not an offer to buy or sell, or a solicitation of any offer to buy or sell, any of the securities mentioned herein.
Certain statements contained herein may constitute projections, forecasts, and other forward-looking statements, which do not reflect actual results and are based primarily upon a hypothetical set of assumptions applied to certain historical financial information. Certain information has been provided by third-party sources, and although believed to be reliable, it has not been independently verified, and its accuracy or completeness cannot be guaranteed.
Any opinions, projections, forecasts, and forward-looking statements presented herein are valid as of the date of this document and are subject to change.
All investing is subject to risk, including the possible loss of the money you invest. Past performance is no guarantee of future results.
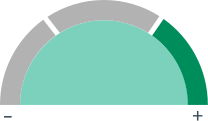
The indicators reflect forecasts of a 6 to 9 month time horizon. The colors of each indicator, as well as the direction of the arrows represent our positive/negative/neutral view for each indicator. Thus, arrows directed towards the (+) sign represents a positive view which in turn makes it green. Arrows directed towards the (-) sign represents a negative view which in turn makes it red. Arrows that land in the middle of the indicator, in line with the (0), represents a neutral view which in turn makes it yellow. All of these indicators combined affect RBC Rochdale’s overall outlook of the economy.
Non-deposit investment Products are: • not FDIC insured • not Bank guaranteed• may lose value
Let's work together.
We partner with financial advisors to provide investment management services to their clients with more than $1 million in investable assets.
If you’re a high-net-worth client who’s interested in adding an experienced investment manager to your financial team, learn more about working with us here



 Top